About European Solar - Megawatt Mosaic
Solar Resource
In this section we take a very broad look at the use of PV in Europe and compare it with the other continents. For those unfamiliar, we also cover the classification of PV systems. To kick things off we look at the available resource, which directly plays into the viability of PV projects, especially unsubsidised ones.
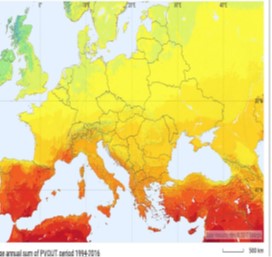
As you might expect, latitudes below 45° have the strongest solar resource, as measured by the average annual energy output of a unit size of PV, see Figure 1, above left. This means that Southern European countries (e.g. Spain, Portugal) have conditions for PV that are excellent -if not the absolute best-from a worldwide perspective. As we move up through Europe, the resource declines notably, see Figure 2, above right. Despite this, some of the more northerly countries in Europe (e.g. Germany, UK) are those that have deployed PV the most. This suggests that the resource is only one of several factors influencing deployment.
Installed Capacity
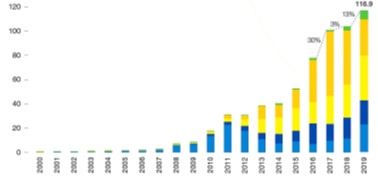
Europe has played an important role in the history of PV, with the launch of Germany’s feed-in tariff scheme at the start of the century arguably the starting point of the grid-connected PV era (we explain feed-in tariffs later; in short, they are a subsidy). In the space of two decades, PV has grown to a cumulative installed capacity worldwide of over 630 GW,
During this exponential growth period, Europe remained the dominant force in terms of yearly capacity additions until about 2013, when the Asia-Pacific and China regions began their own meteoric ascents. It also remained the largest market by cumulative capacity until about 2017, when phenomenal growth in China pushed Europe down to the second largest market.
After flat-lining during the middle of the 2010s, a new growth phase has developed in Europe over the last few years, both for the continent and the subset of this that is the EU. After increasing 21% to 11.2 GW in 2018, annual PV additions in Europe more than doubled to 22.9 GW in 2019 (with the EU adding 16.7 GW of this). This was ~20% of global PV additions in 2019. Note that in this document 2020 is included in the ‘Market Forecast’ section.